
Land Area and Population

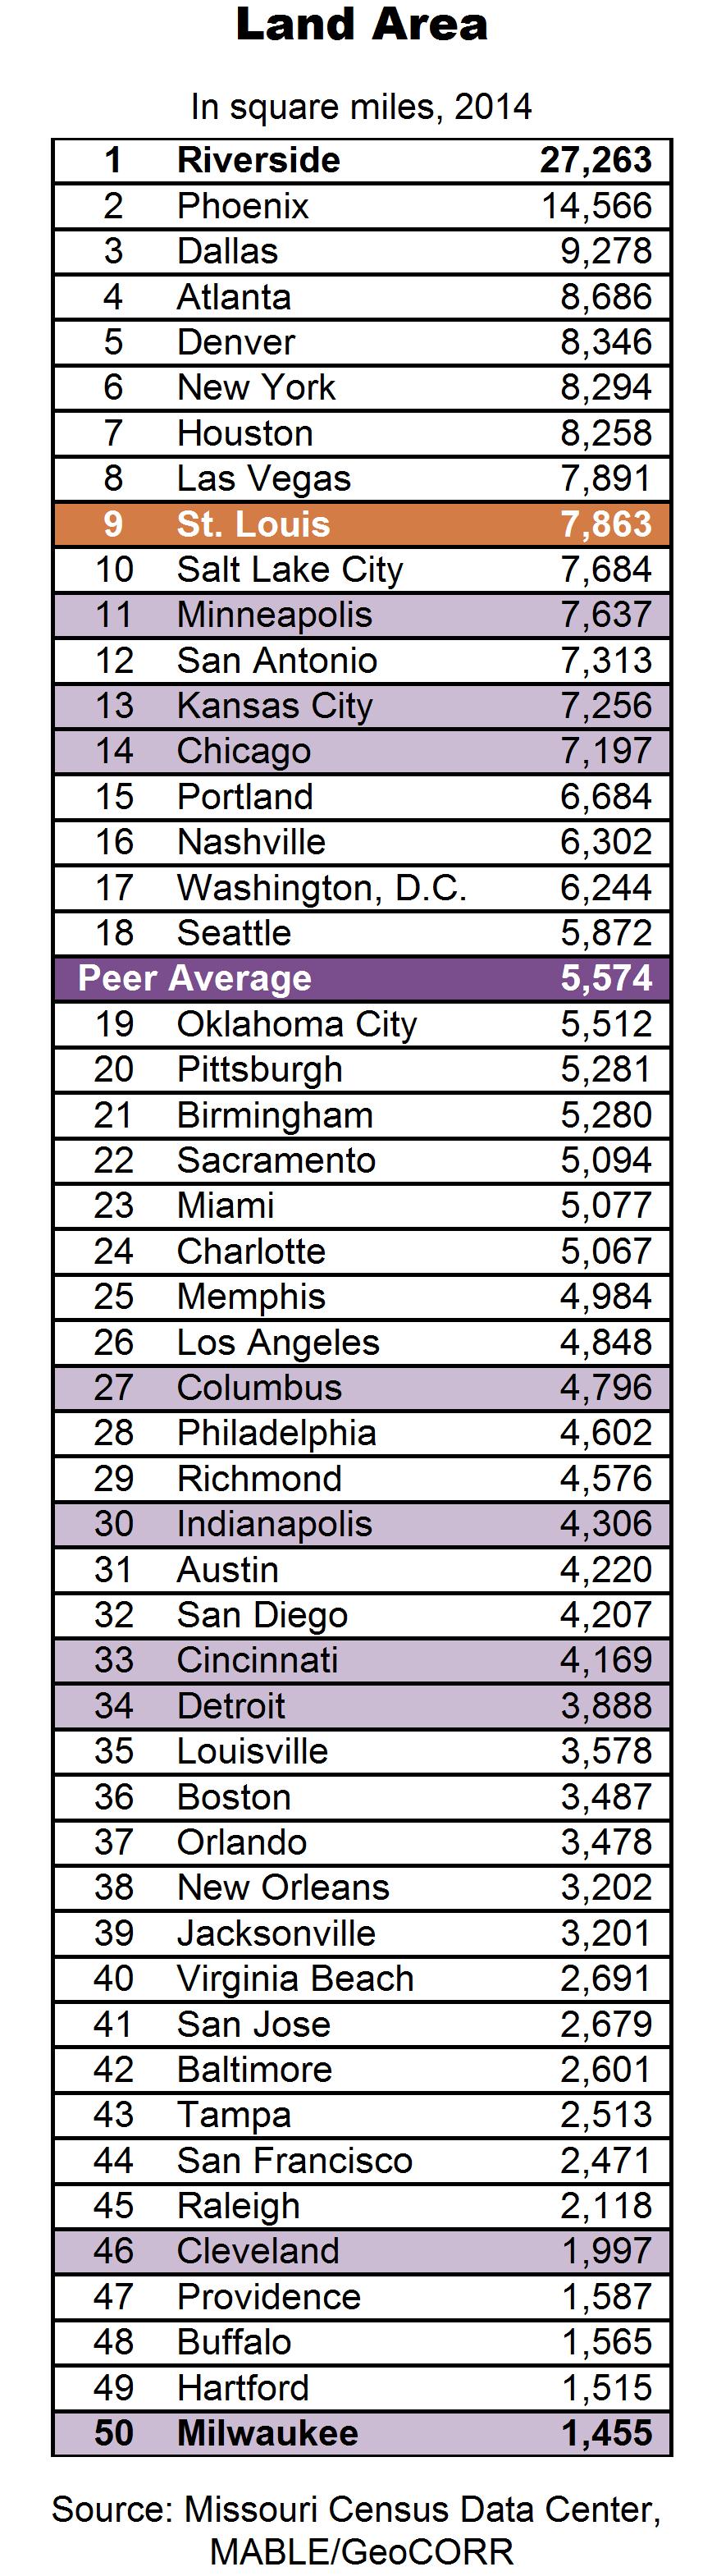
The St. Louis MSA is the 9th largest metropolitan area in the United States in terms of land area and the 21st largest in terms of population with more than 2.8 million residents and 7,800 square miles of land area. The Land Area and Population tables, as well as other tables throughout this profile of the region, are part of the East-West Gateway Council of Governments (EWG) Where We Stand series, which ranks St. Louis among the 50 most populous regions in the country (the peer regions) on a range of factors important to the region.
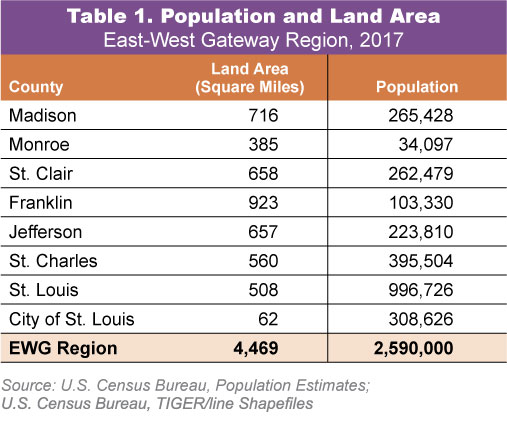 The EWG region includes 92 percent of the St. Louis MSA’s population base (at more than 2.5 million residents) and more than 50 percent of the St. Louis MSA’s land area (at more than 4,400 square miles).
Table 1 shows the land area and population for each county in EWG’s service area. St. Louis County is the most populous county in the region with close to one million residents. Franklin County has the most land area at 923 square miles.
Local Governments
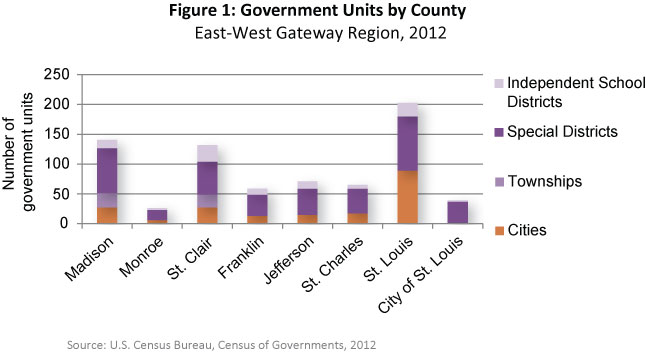
The St. Louis MSA has 1,034 general and special purpose governments – the 5th highest number of local governments when compared to other large MSAs. In the EWG service area, there are 743 units of government (county, municipal, and township governments along with school districts and special districts). St. Louis County has the largest number of governments with 88 municipalities, 91 special districts, and 23 school districts. Figure 1 shows the number of governmental units by county in the EWG service area.
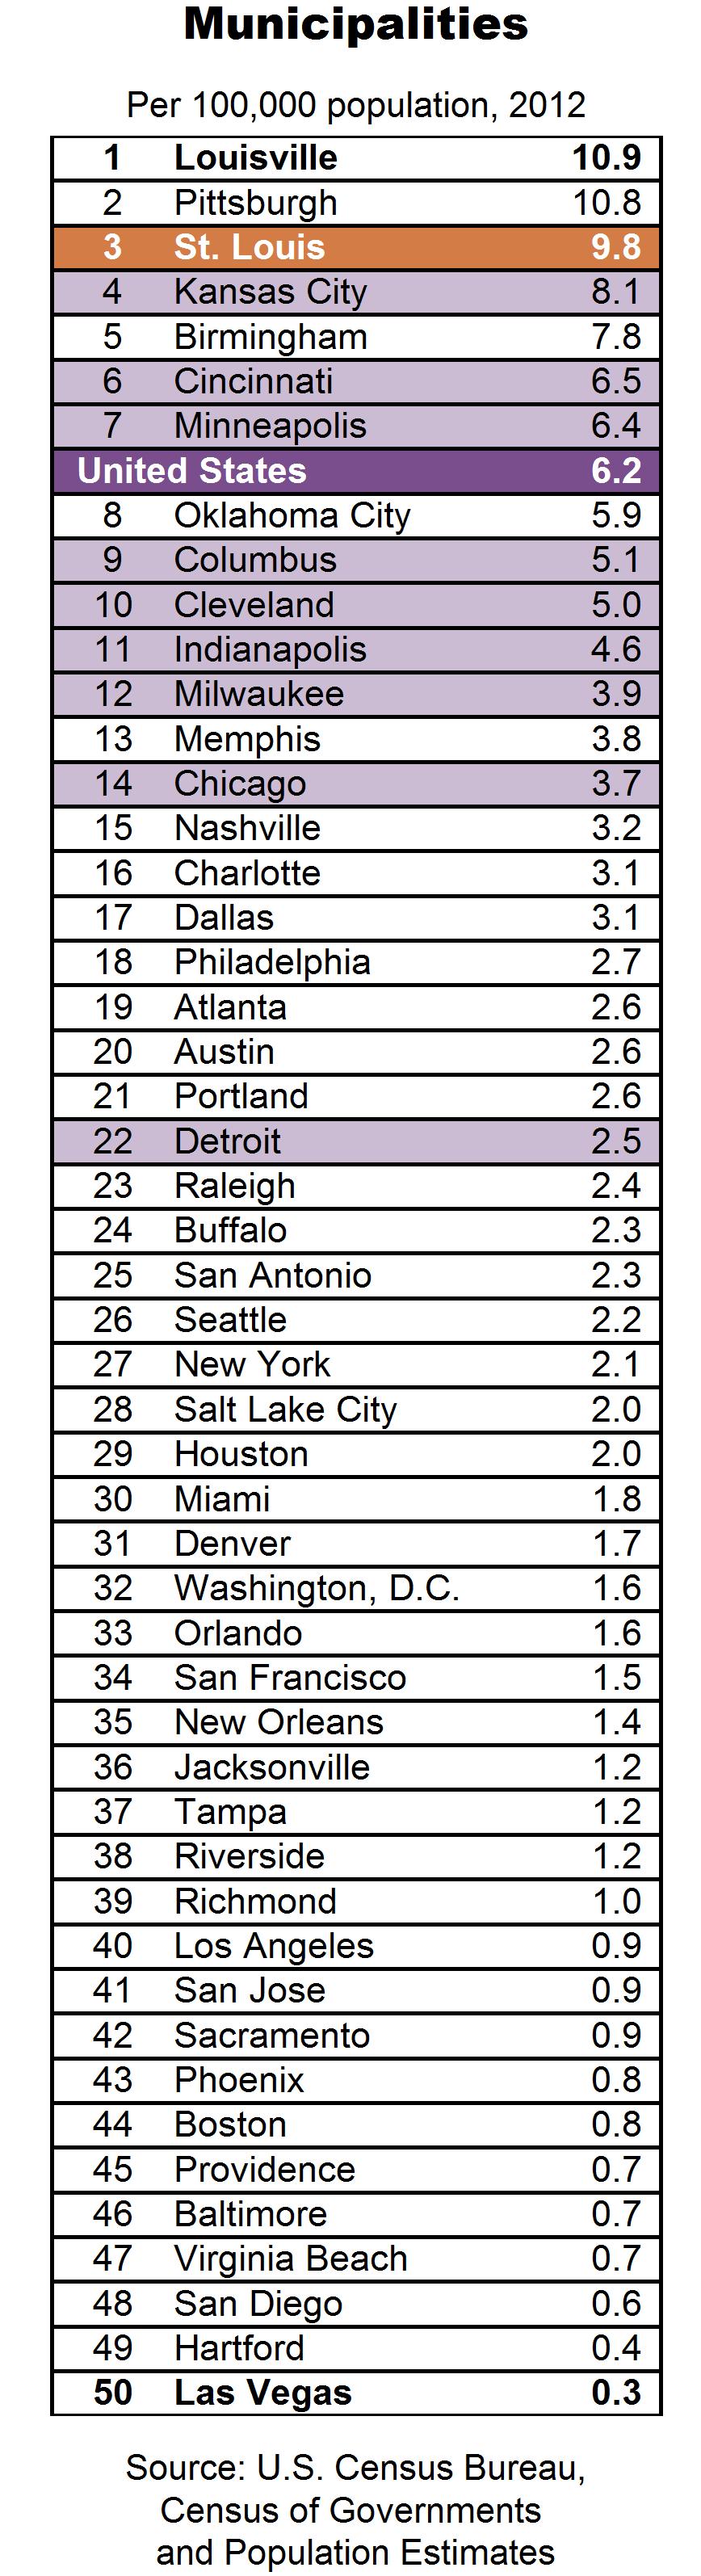
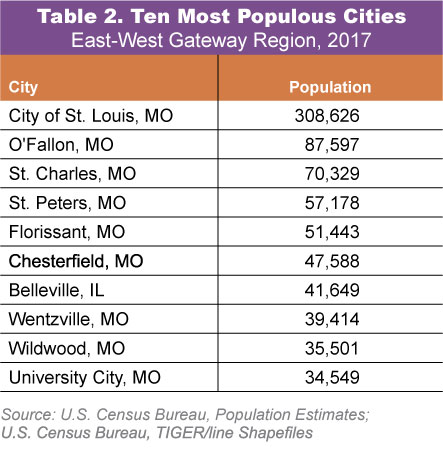 With 273 municipalities, the St. Louis MSA has 9.8 municipalities for every 100,000 residents – the 3rd highest among the peer regions. Overall, the EWG service area includes 196 municipalities. The 10 most populous are shown in Table 2.
Jobs and Industry

In 2017, an estimated $161 billion of the $19.0 trillion in U.S. gross domestic product was produced in the St. Louis MSA. In the same year, the EWG service area was home to 1.69 million jobs, 95 percent of the St. Louis MSA’s employment base. Although the manufacturing industry continues to employ over 100,000 people in the EWG service area, the service sector has long surpassed manufacturing in the share of the St. Louis region’s economic activity. Table 3 shows employment by industry in the EWG service area.
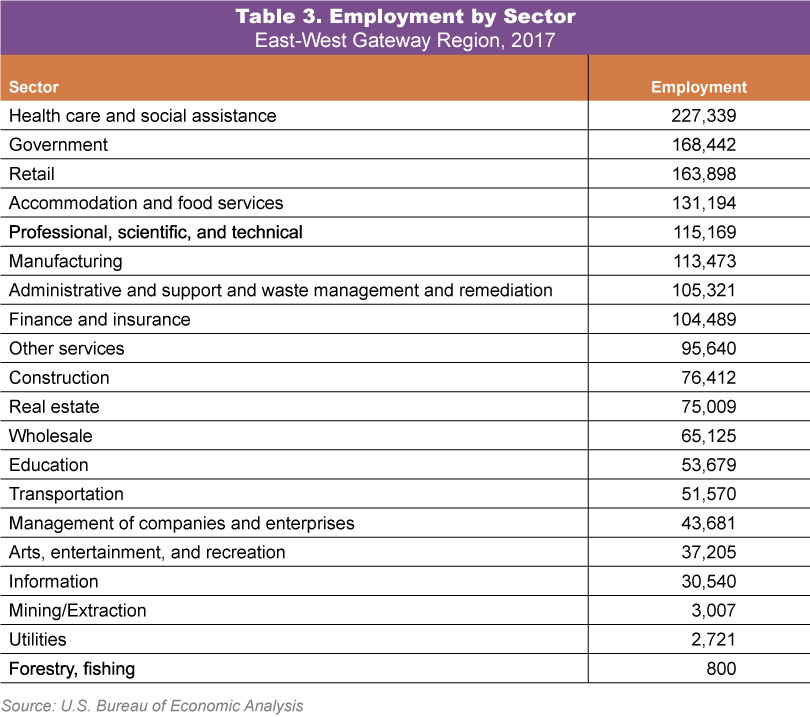 The economy of the St. Louis region is diverse with no single industry dominating employment. The proportion of jobs by industry is similar to that of the United States with two exceptions. The region’s largest industry, health care and social assistance, makes up a greater percentage of employment than for the country as a whole. Government is one sector that is proportionally smaller in St. Louis than it is for the United States as a whole.
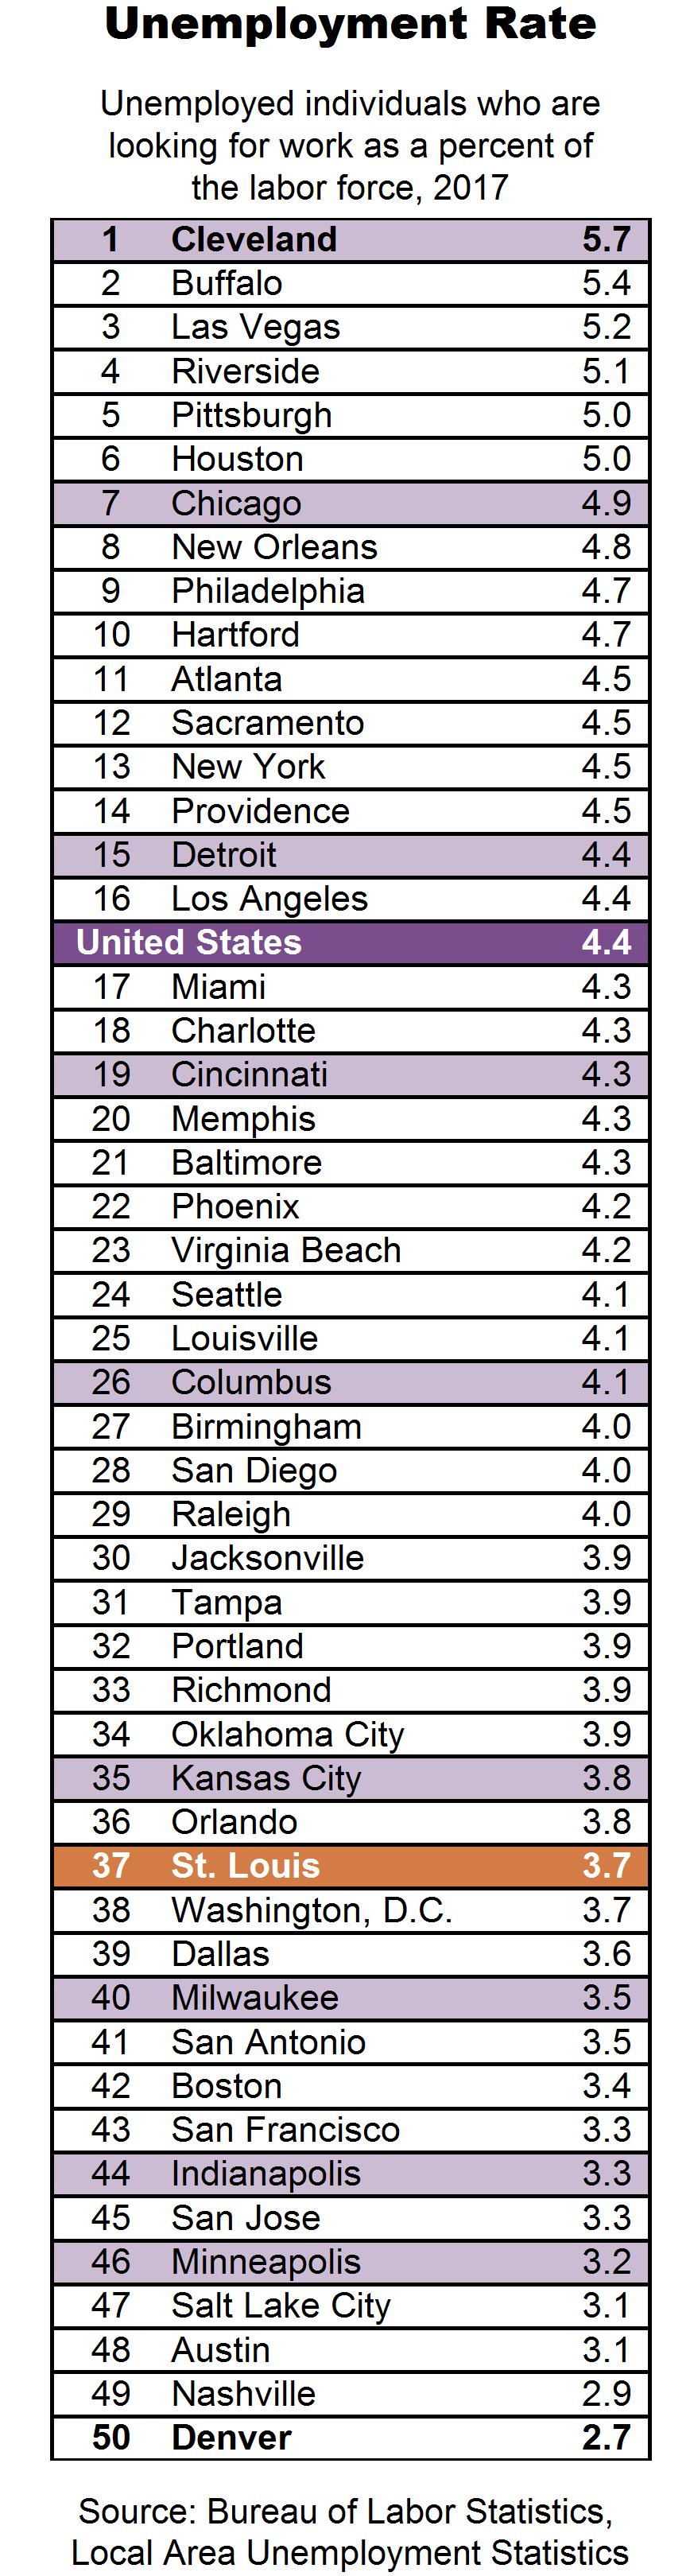
This mix of employment provides a stable economy relative to many of the peer regions that experience larger swings in employment and unemployment. As shown on the Unemployment Rate table, St. Louis has one of the lowest rates of unemployment among the peer regions, 3.7 percent in 2017.
The region has many assets in two areas that have the potential to grow the economy—innovation and freight. The St. Louis region is home to many innovative institutions, including four research universities, the Danforth Plant Science Center, innovation incubators such as Cortex and T-REX, and companies such as Monsanto and Boeing. This foundation of innovation is a strong driver of economic growth in the global economy. See where St. Louis stands on innovation in the economy chapter of Where We Stand.
Freight is another area where there is high potential for economic growth. Among non-coastal regions, St. Louis is one of the leading MSAs in terms of freight. St. Louis has six class I railroads and four interstates with access in all directions, is the third largest inland port, is served by six interstate natural gas pipelines, and has two major commercial/ cargo airports. The St. Louis MSA shipped over 380 million tons of freight in 2016, at a value of around $354 billion, ranking 13th among the peer regions.
Residents
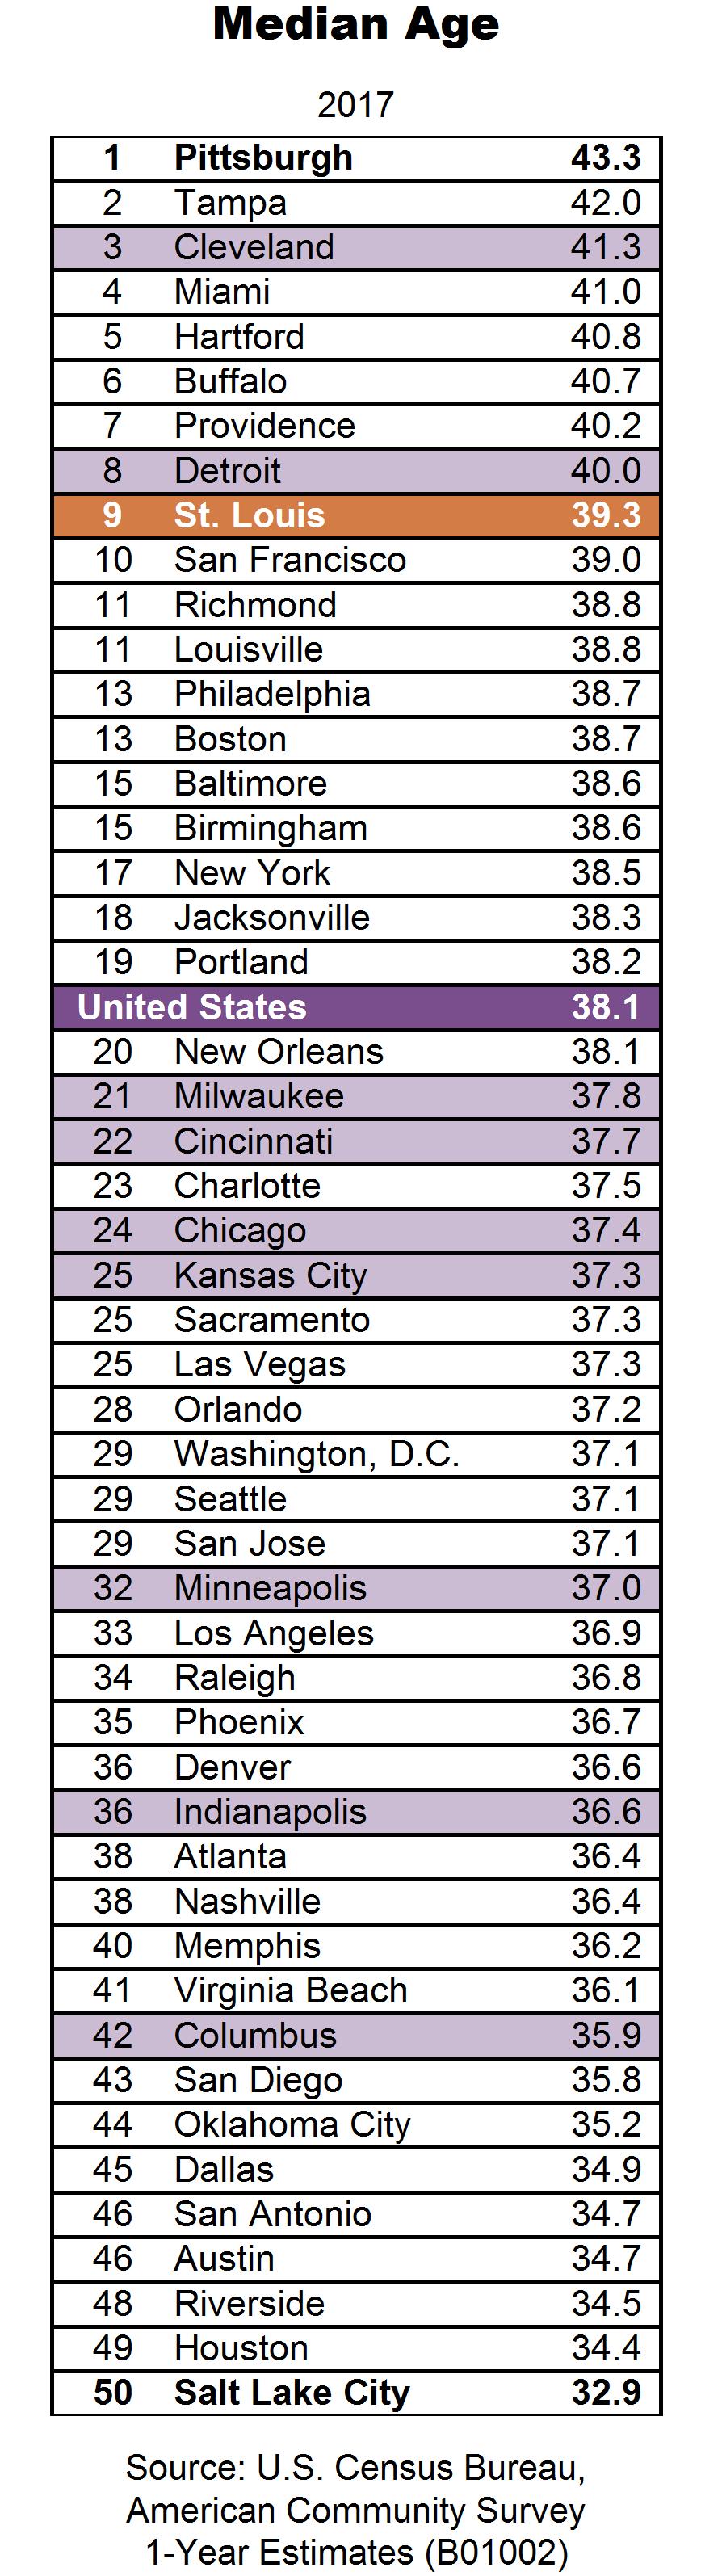
St. Louis has an older median age than many of the peer regions and the United States as a whole. The median age for the region in 2017 was 39.3, compared with 38.1 for the United States.
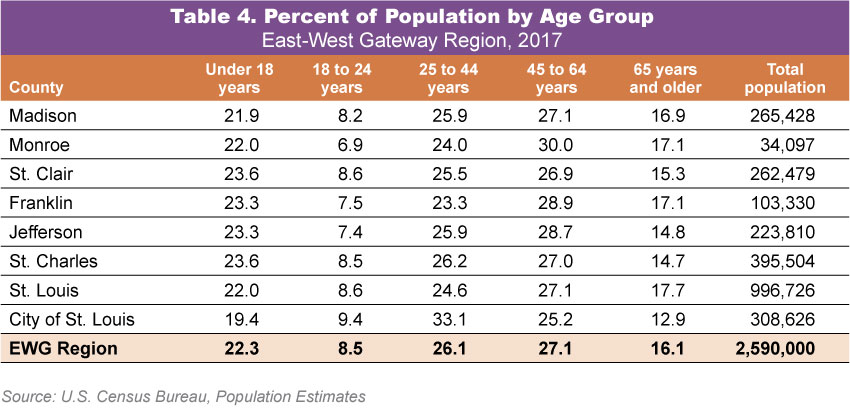 Table 4 provides the age distribution by county for the EWG region. Among the eight jurisdictions, the city of St. Louis has the largest proportions of residents aged 18 to 24 and aged 25 to 44. For all other age categories – the youngest and oldest—the city of St. Louis has the smallest percentages. St. Louis County has the largest proportion of people 65 years and older.
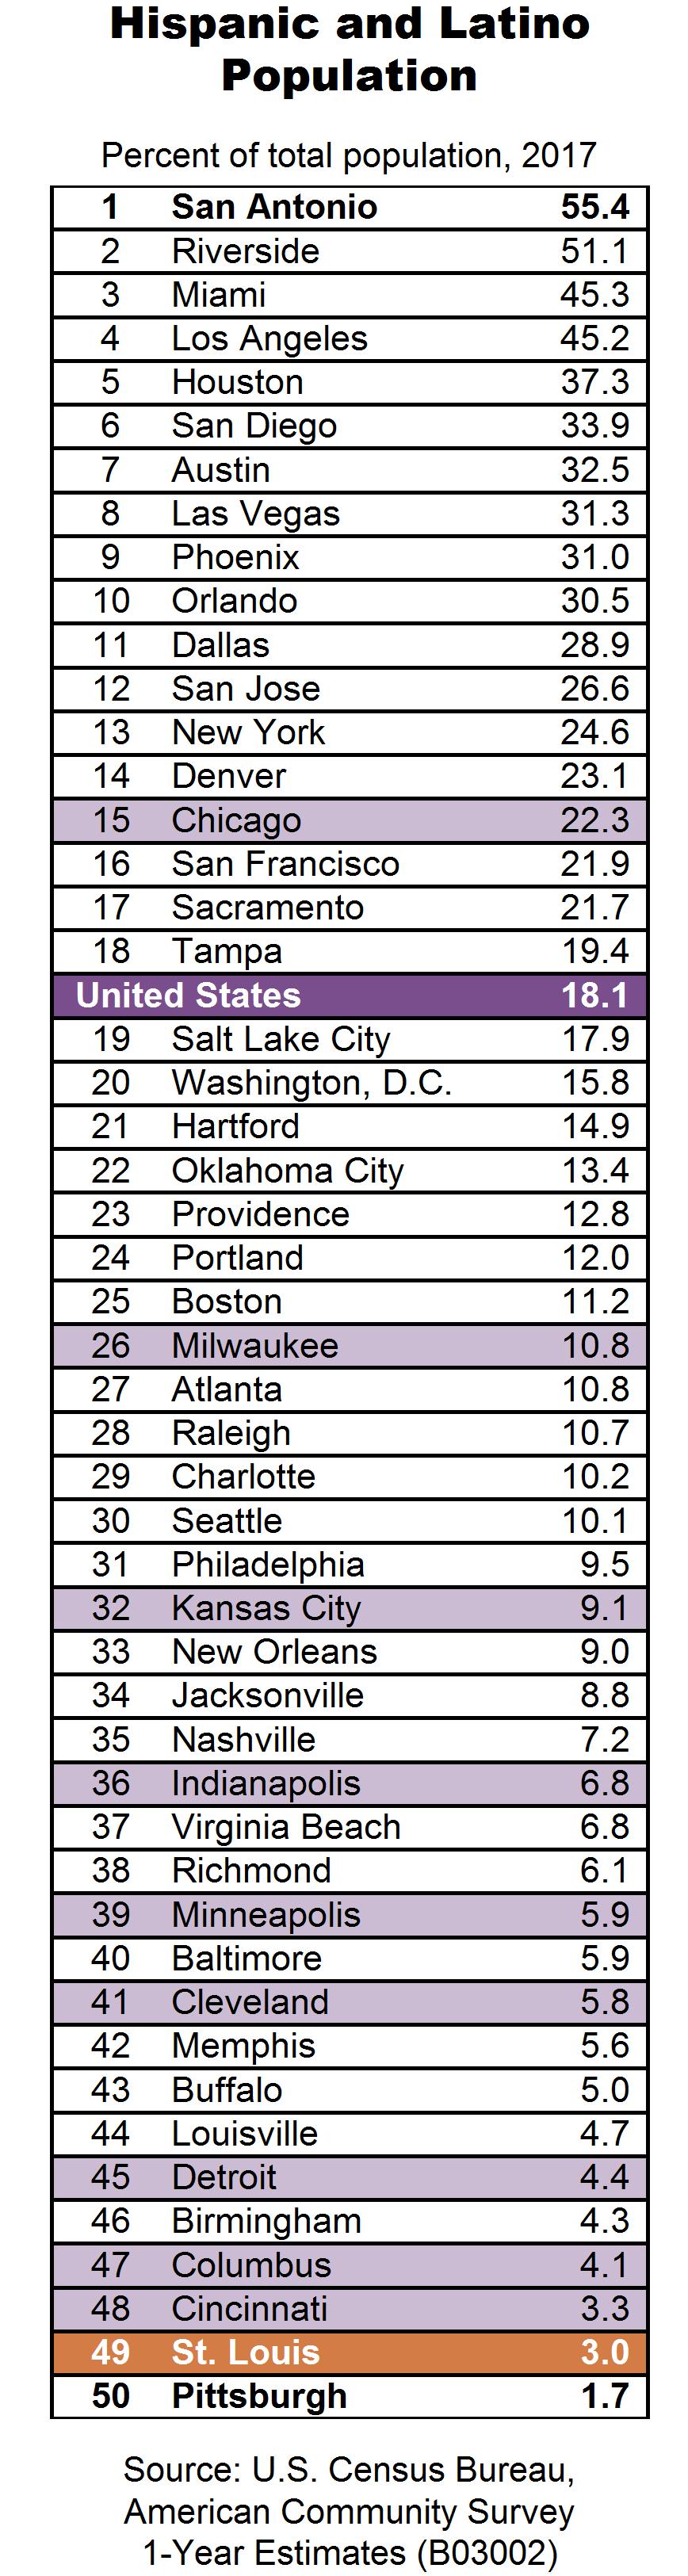
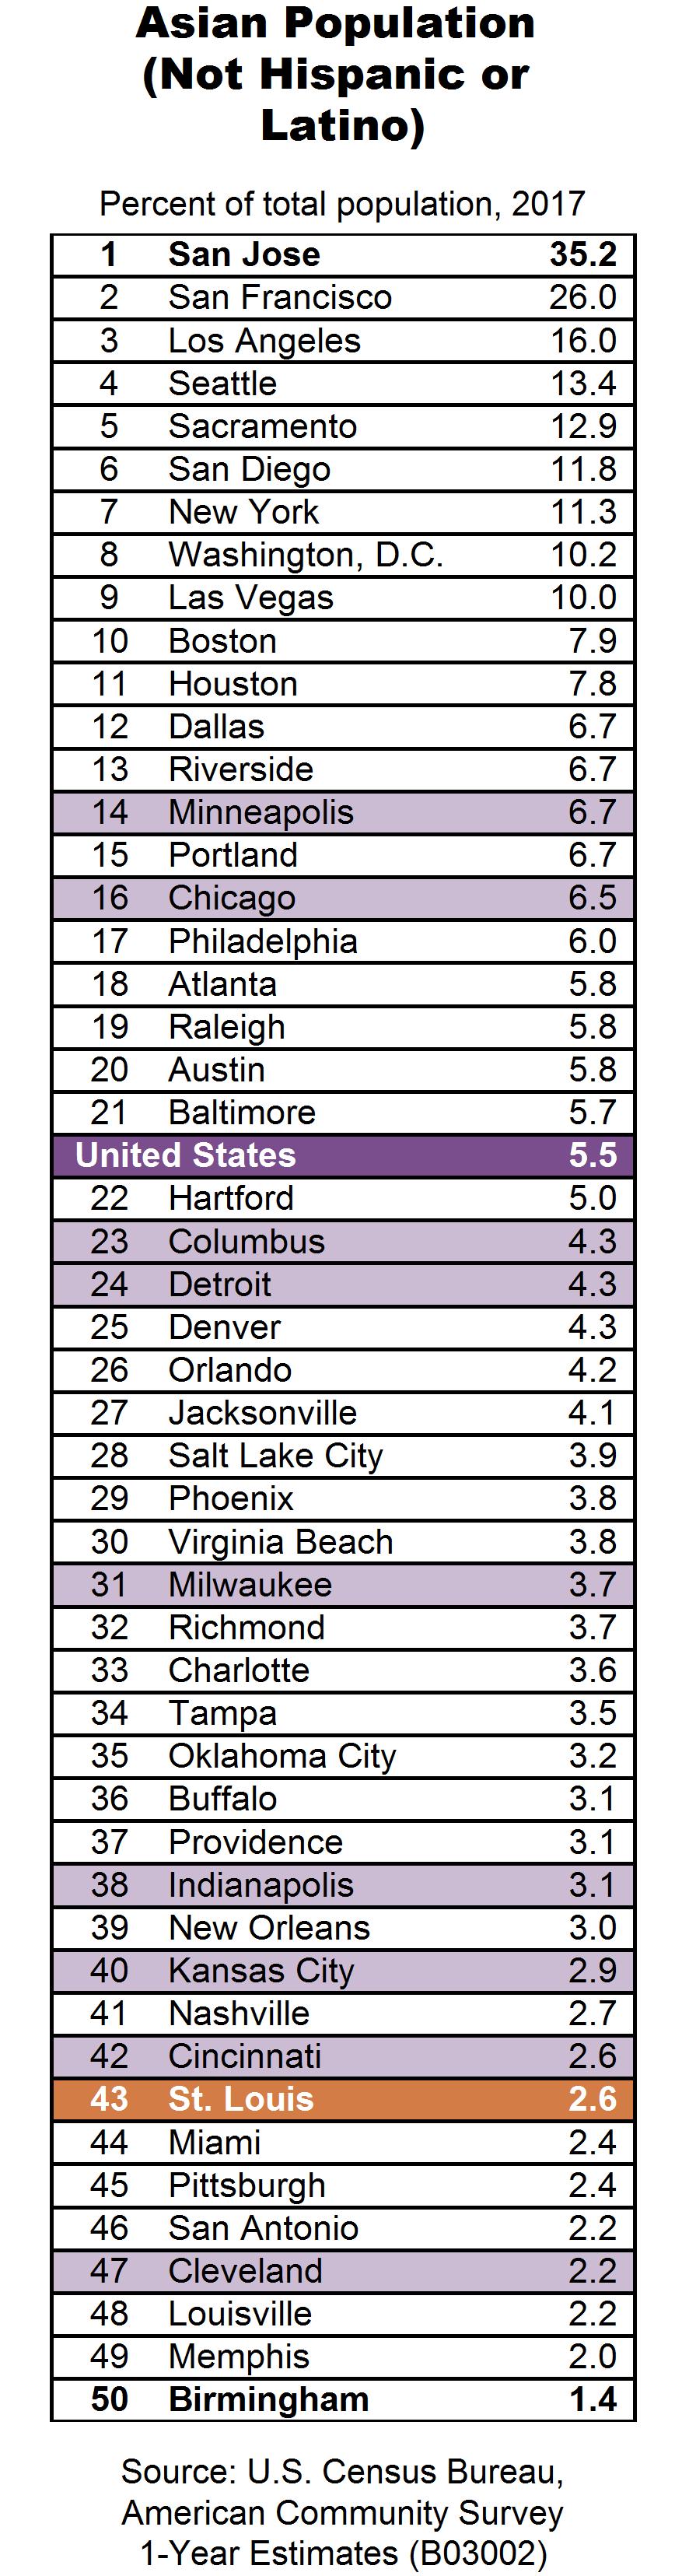
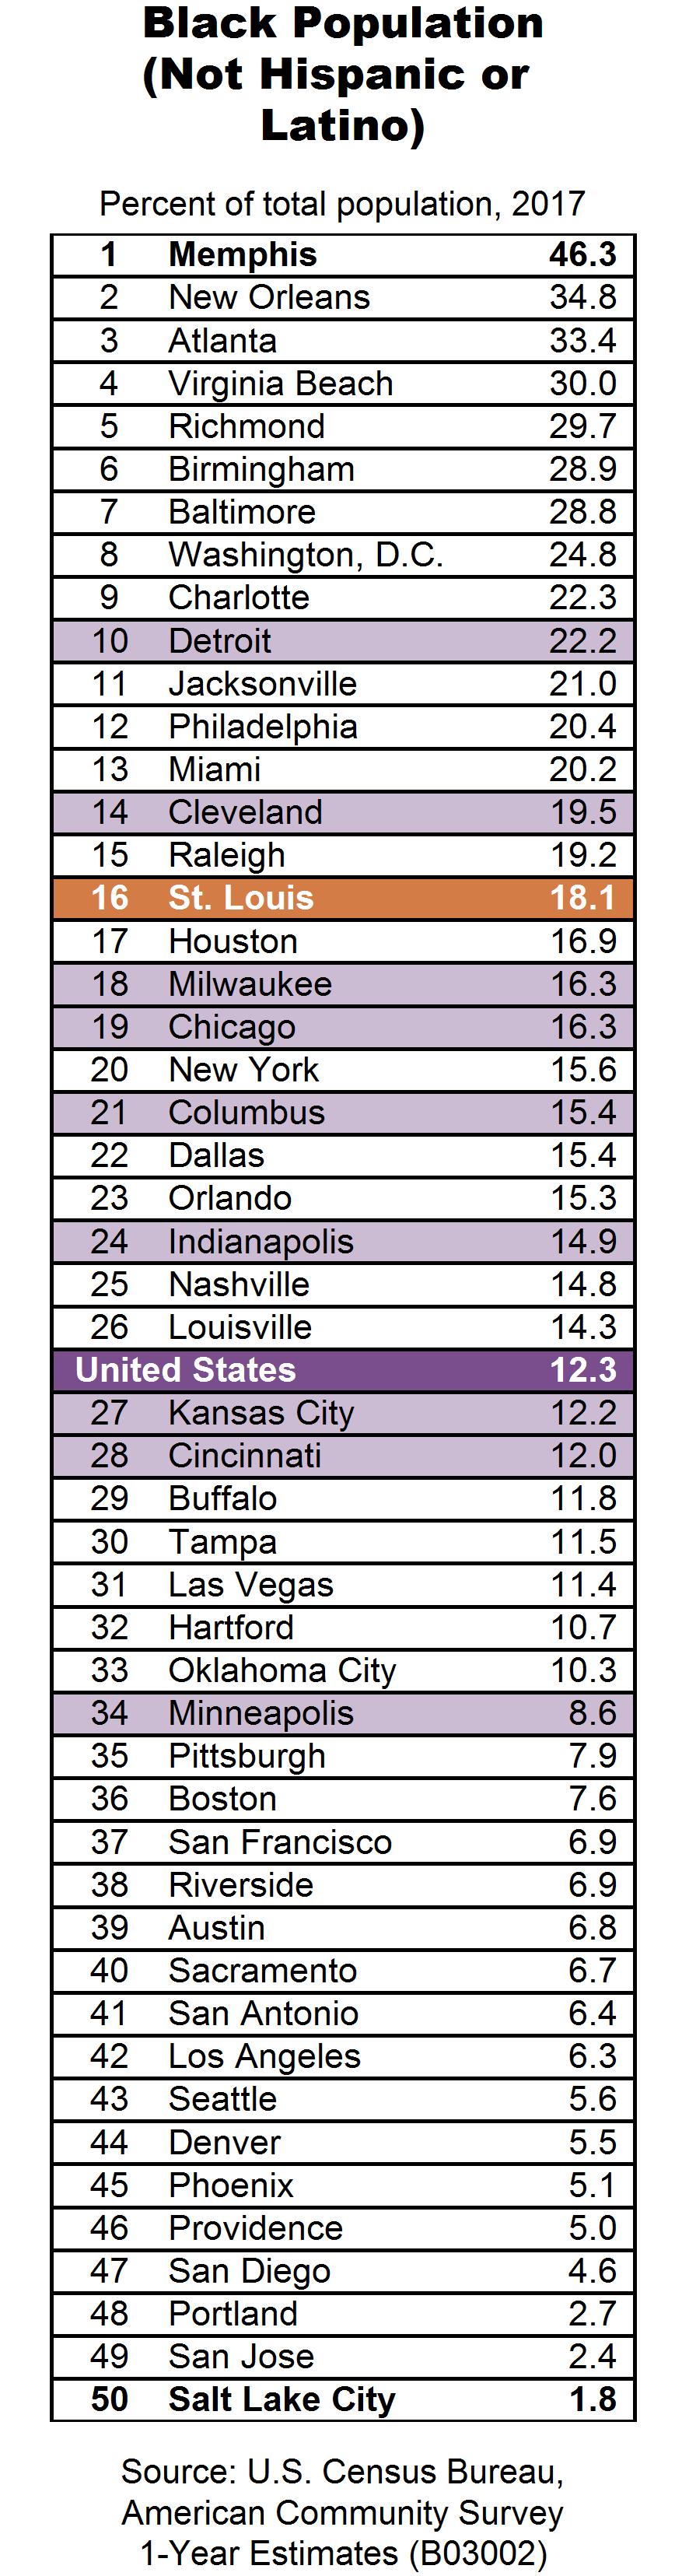
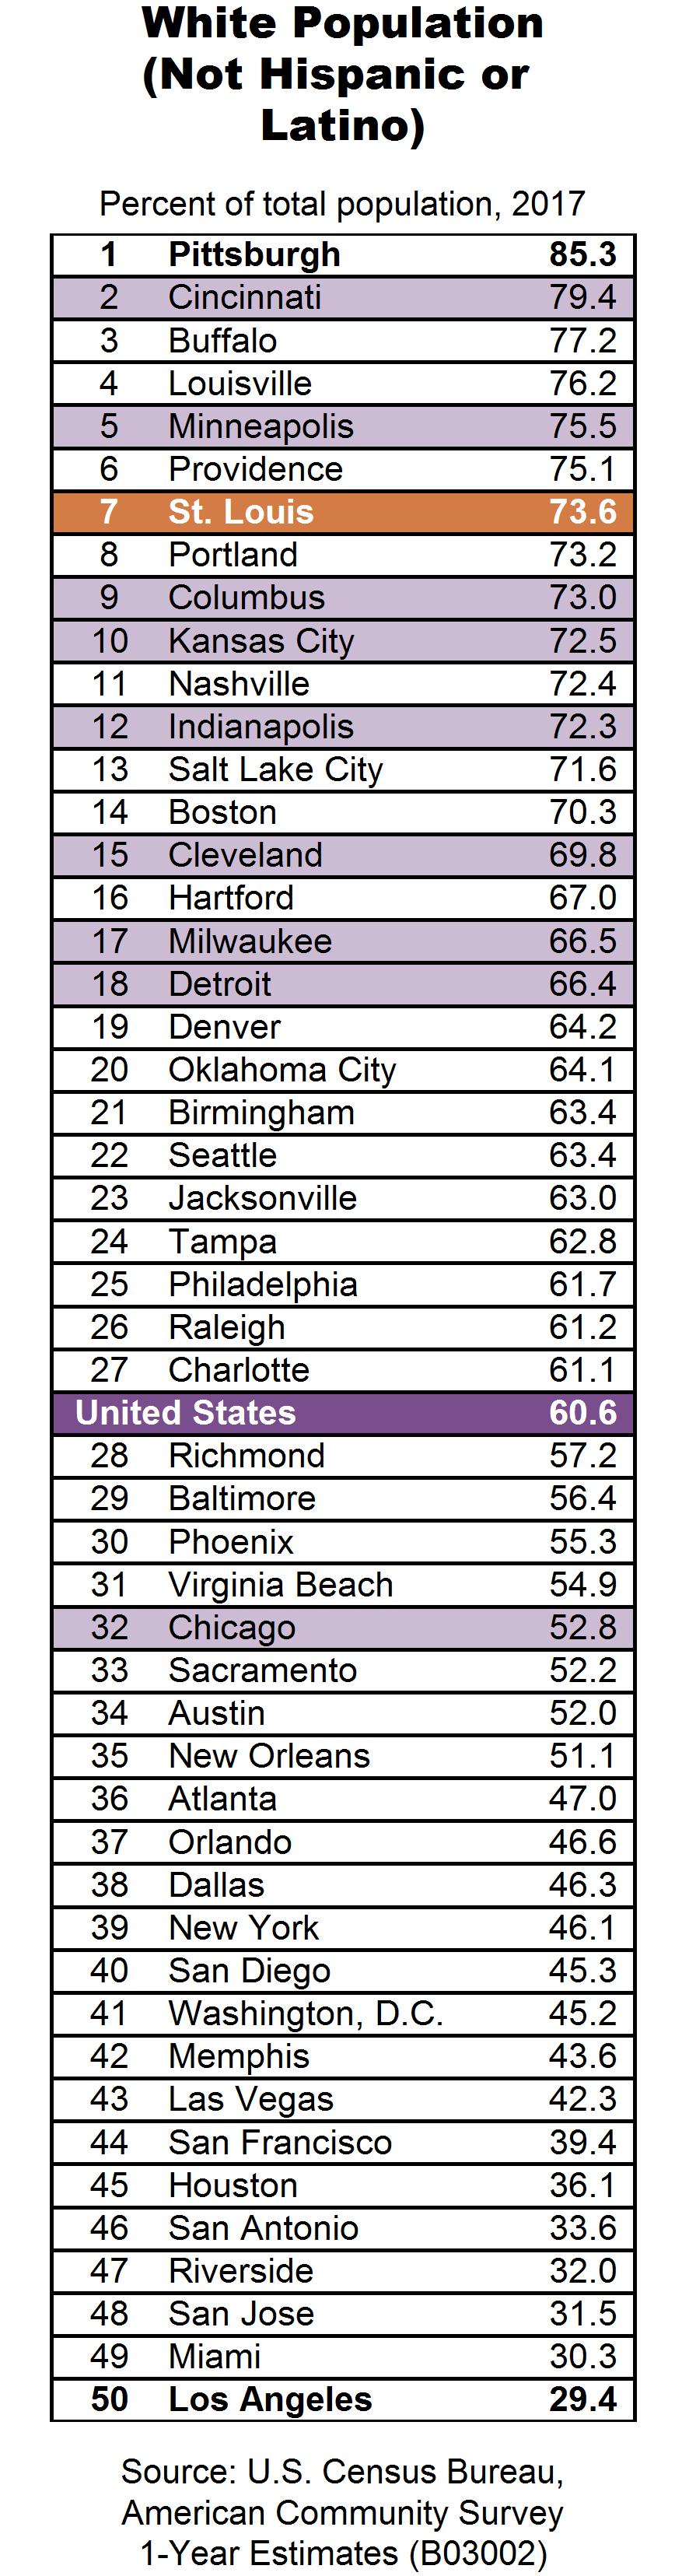
 St. Louis is overwhelmingly black and white. About 3 percent of individuals in the MSA self-identify as Hispanic and about 2.6 percent identify as Asian. In 2017, among the peer regions, St. Louis had the 7th largest proportion of white (non-Hispanic or Latino) population, at 73.6. The region also has a large black population relative to the peer regions and to the United States while the Asian and Hispanic populations in the region are relatively small.
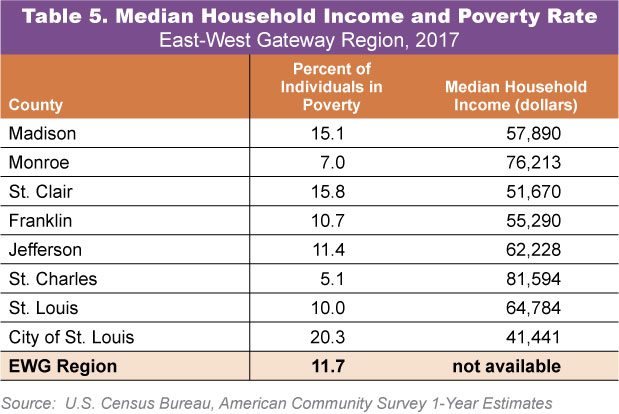
 St. Louis has a median household income that is about the same as the median for the entire country, about $61,000, ranking 31st among the peer regions. Table 5 shows the median income and poverty rates by county for the EWG region. The median income ranges from a low of $41,441 in the city of St. Louis to a high of $81,594 in St. Charles County. The poverty rate ranges from a low of 5.1 percent in St. Charles County to a high of 20.3 percent in the city of St. Louis.
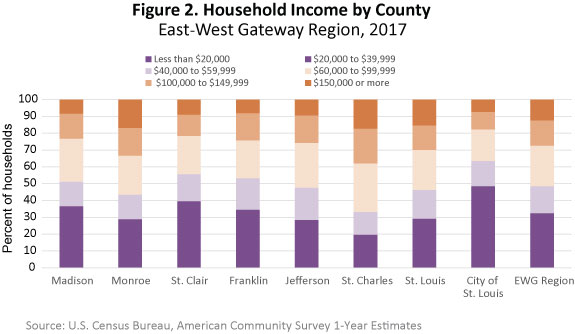
Figure 2 shows the proportion of each county’s population that falls into six income ranges. The city of St. Louis has the largest proportion of people in the lowest category with 37.3 percent of households with an income less than $25,000. St. Charles County has the largest proportion of households with an income over $150,000 (17.2 percent).
Land Use/Land Cover
 Map 1 shows the region color coded by land cover.
In terms of land area, the urban area occupies a relatively small portion of the region’s total area. Most of the land area in the St. Louis region is considered to be open space due to forest and grassland in Franklin and Jefferson counties, and agricultural land in the Illinois counties. However, the St. Louis region ranks 6th among the 50 peer regions on developed land per capita and 7th on change in developed land per capita from 2006 to 2011.