Where We Stand
The Strategic Assessment of the St. Louis Region The Where We Stand (WWS) series produced by East-West Gateway (EWG) has provided comparisons of the St. Louis region with other large…
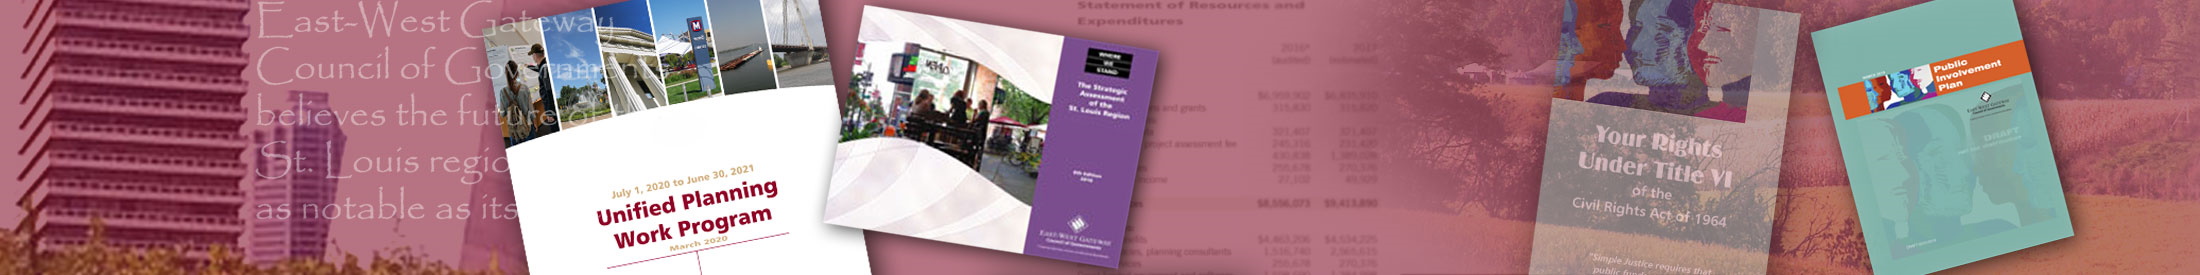
The Strategic Assessment of the St. Louis Region The Where We Stand (WWS) series produced by East-West Gateway (EWG) has provided comparisons of the St. Louis region with other large…
The interactive tool below displays changes in per capita income (PCI) levels, relative to the United States, for the 50 most populous Metropolitan Statistical Areas (MSAs). For each MSA, per…
EWG prepares tables showing the daily maximum eight-hour ozone average, in parts per billion (ppb), by air quality monitor in the St. Louis (MO-IL) region. The tables listed below use…
Listed below are the Air Quality Index (AQI) calendars which use the 1997 standard of 85 ppb (years 2001-2007). AQI calendars graphically present the maximum daily eight-hour ozone AQI values…
The work in the Research department is designed to develop a sound factual basis for investment decisions for the St. Louis region’s surface transportation system and for the other systems…
Land Area and Population The St. Louis MSA is the 9th largest metropolitan area in the United States in terms of land area and the 21st largest in terms of…
The Surface Transportation Program – Suballocated (STP-S) is part of the Competitive Programs that East-West Gateway Council of Governments (EWG) administers. STP-S projects, like all federally funded transportation projects, are…
The East-West Gateway Map of the Month for December highlights the most recent National Wetlands Inventory for the East-West Gateway region. These data depict: the lakes (36.12 square miles), riverine…
Plan amendments to the 1978 208 Water Quality Plan:
East-West Gateway’s June 2023 Map of the Month depicts bike facilities available for public use in the East-West Gateway region. In total, there are at least 1,086 miles of bike…